

WORLD GOLD / ORIGINAL RESEARCH
Charted: Gold, Silver and Platinum Prices Since 2011
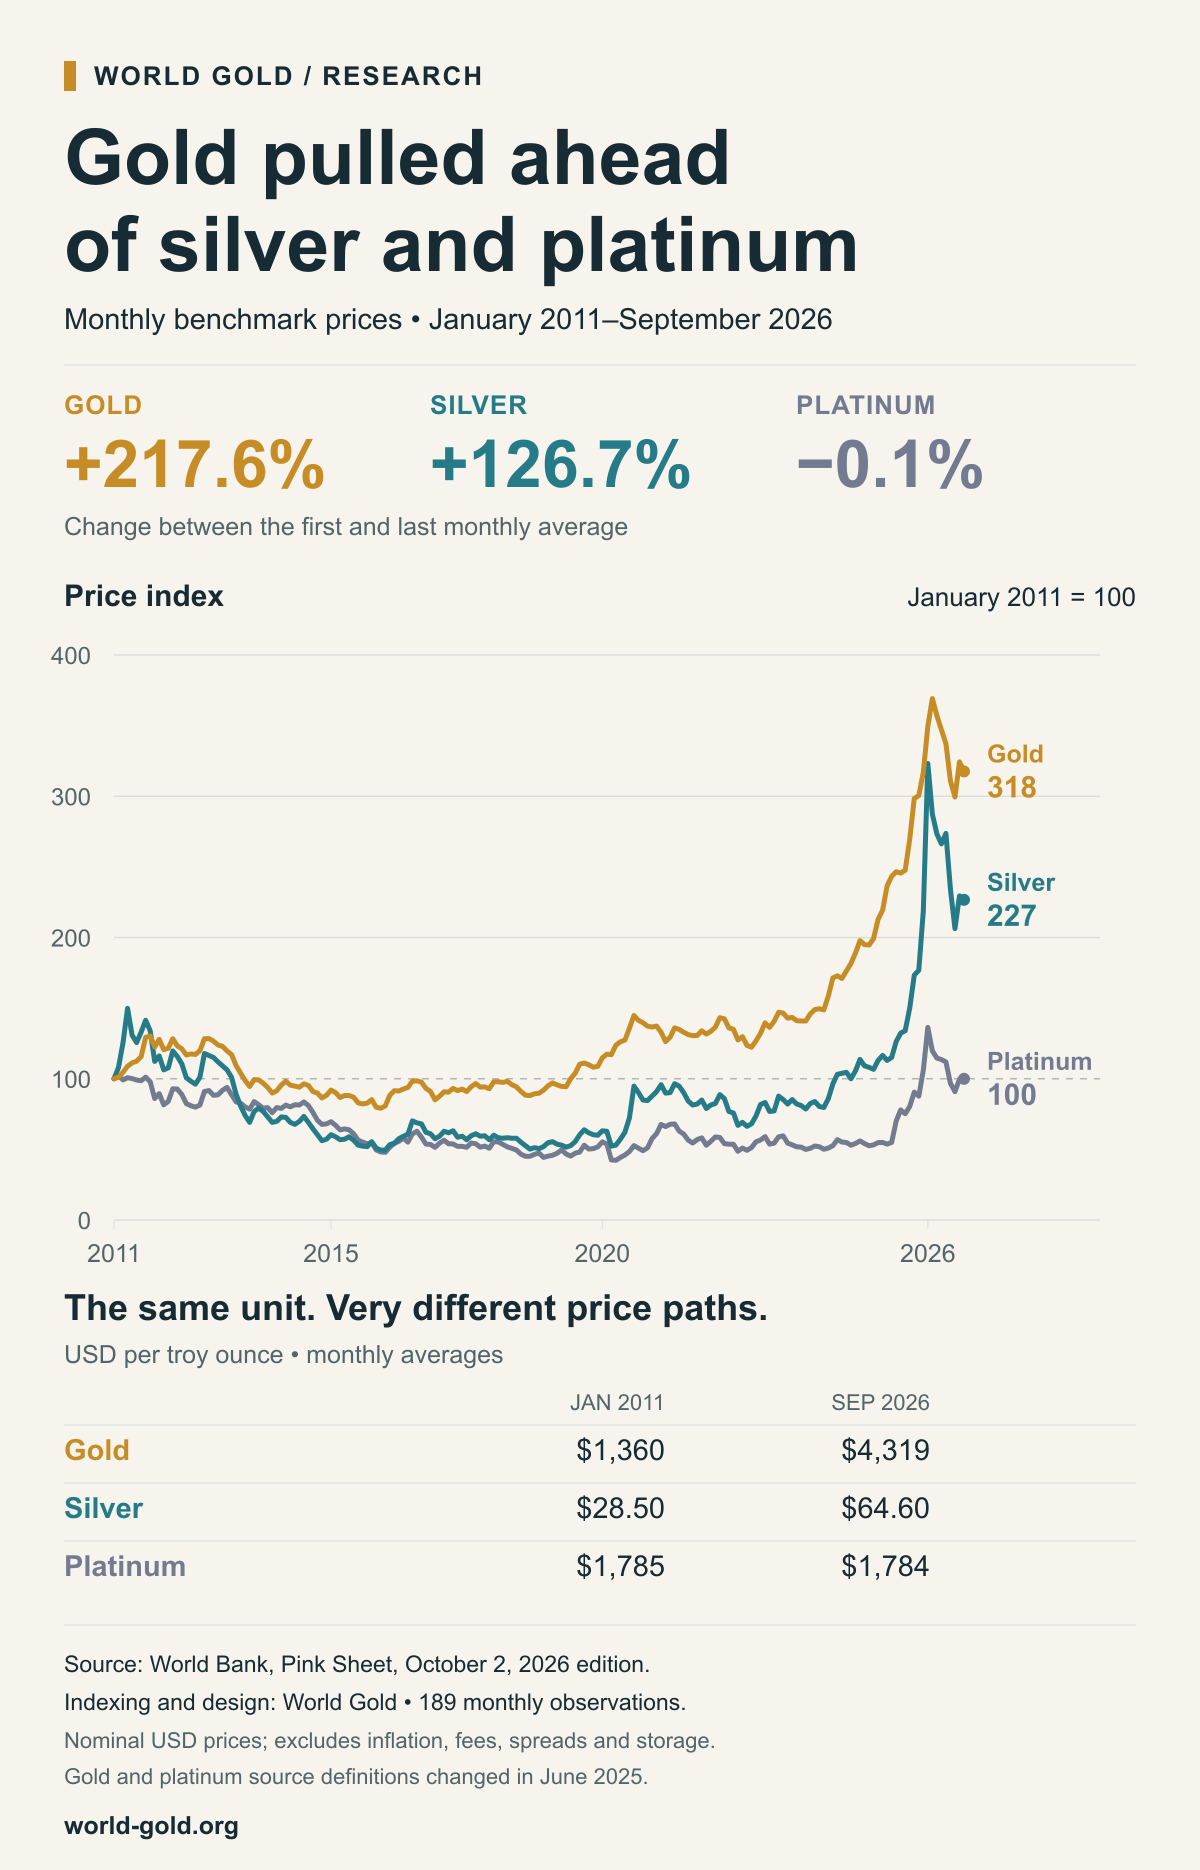
Gold more than tripled between January 2011 and September 2026, while platinum ended close to where it began.
Data through September 2026 · World Bank Pink Sheet, October 2, 2026 edition
Three metals, three different paths
Gold, silver and platinum share a place in precious-metals markets, but their prices did not follow the same path. We indexed 189 monthly observations from the World Bank’s Pink Sheet to compare their relative changes from a common starting point.
| Metal | Jan 2011 | Sep 2026 | Price change |
|---|---|---|---|
| gold | $1,360 | $4,319 | +217.6% |
| silver | $28.50 | $64.60 | +126.7% |
| platinum | $1,785 | $1,784 | −0.1% |
Gold finished ahead
Gold’s monthly average rose from $1,360 to $4,319 per troy ounce, an increase of 217.6%. Silver rose from $28.50 to $64.60, up 126.7%. Platinum moved from $1,785 to $1,784, a decline of 0.1% after rounding.
A nearly flat endpoint hides a moving market
Platinum’s final value does not mean its price stayed still. Its highest monthly average in this selected period was $2,434 in January 2026. The full series shows fluctuations that a start-to-finish percentage leaves out.
The gold–platinum relationship changed too
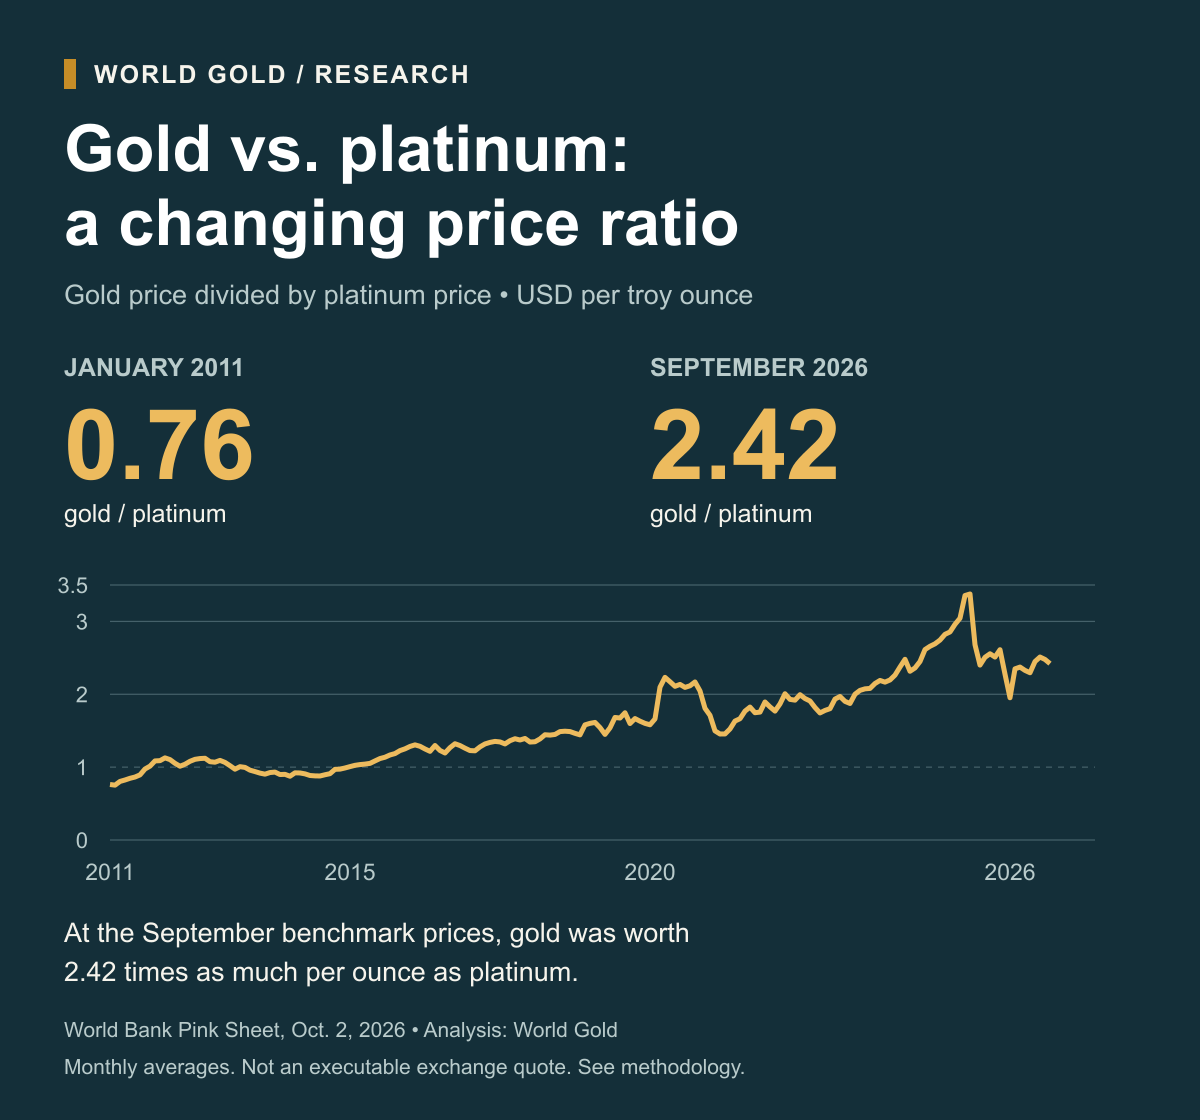
In January 2011, the gold-to-platinum price ratio was 0.76. By September 2026, it was 2.42. This compares the monthly benchmarks in the same currency and weight unit. At the September benchmarks, gold was worth 2.42 times as much per ounce as platinum; this is not a dealer’s exchange offer.
Sources and methodology
The comparison uses the World Bank Commodity Price Data (Pink Sheet), October 2, 2026 edition, and the Gold, Silver and Platinum columns in its historical monthly workbook. Coverage is January 2011–September 2026, inclusive: 189 consecutive monthly observations.
Every series starts at 100 in January 2011. An index level of 200 means the monthly benchmark doubled from that baseline. We retain the published observations without interpolation or adjustments at source-definition changes.
- Price index
- Monthly price ÷ January 2011 price × 100
- Price change (%)
- (September 2026 price ÷ January 2011 price − 1) × 100
- Gold/platinum ratio
- Gold monthly price ÷ platinum monthly price
Prices are monthly averages in nominal U.S. dollars per troy ounce, rather than daily closes or retail quotes. Inflation, taxes, premiums, bid–ask spreads, storage and other ownership costs are excluded. These are benchmark price changes, not the total returns of physical bars, coins or a fund.
Source definitions and the June 2025 change
- Gold: spot average of daily rates from June 2025; previously UK 99.5% fine, London afternoon fixing, average of daily rates.
- Platinum: 99.95% minimum purity, plate or ingot form, spot average of daily rates from June 2025; previously UK 99.9% refined, London afternoon fixing.
- Silver: UK 99.9% refined, London afternoon fixing.
The official series are retained as published. Purity and reference conventions are not identical across metals. The chart does not remove possible effects of the source-definition changes.
Why the starting month matters
January 2011 is a declared common baseline, not a claimed optimal investment date. Starting in December 2010 instead gives gold +210.5%, silver +120.5% and platinum +4.3% through September 2026. Starting in January 2012 gives +161.1%, +110.4% and +19.0%, respectively. The nearly flat platinum endpoint is specific to the selected January 2011 baseline.
The source workbook snapshot was retrieved on October 30, 2026. September endpoint values were checked against the official October Pink Sheet on November 6, 2026. This fixed-period analysis does not include October observations or forecast future prices.
Underlying data: World Bank, Commodity Prices dataset, CC BY 4.0. World Gold selected the series and period, calculated indices, changes and ratios, and designed the graphics. Attribution does not imply World Bank endorsement. The data licence does not assign the same licence to the article and graphic design.
Download full methodology and provenance · Download summary CSV
Explore and download the data
The CSV contains all 189 monthly prices, the three January-2011-based indices and the gold/platinum ratio. Prices below retain the source’s published precision; derived CSV columns use eight decimal places for reproducibility, not extra source accuracy.
Download all monthly data (CSV) ↓View all 189 monthly observations
| Month | Gold | Silver | Platinum | Gold / platinum |
|---|---|---|---|---|
| 2011-01 | $1,360 | $28.50 | $1,785 | 0.76 |
| 2011-02 | $1,375 | $30.80 | $1,826 | 0.75 |
| 2011-03 | $1,423 | $35.80 | $1,770 | 0.80 |
| 2011-04 | $1,481 | $42.70 | $1,798 | 0.82 |
| 2011-05 | $1,513 | $37.30 | $1,787 | 0.85 |
| 2011-06 | $1,529 | $35.80 | $1,769 | 0.86 |
| 2011-07 | $1,573 | $37.90 | $1,760 | 0.89 |
| 2011-08 | $1,759 | $40.30 | $1,805 | 0.97 |
| 2011-09 | $1,772 | $38.20 | $1,748 | 1.01 |
| 2011-10 | $1,666 | $32.00 | $1,535 | 1.09 |
| 2011-11 | $1,739 | $33.10 | $1,597 | 1.09 |
| 2011-12 | $1,640 | $30.30 | $1,455 | 1.13 |
| 2012-01 | $1,654 | $30.70 | $1,499 | 1.10 |
| 2012-02 | $1,745 | $34.10 | $1,658 | 1.05 |
| 2012-03 | $1,676 | $33.00 | $1,655 | 1.01 |
| 2012-04 | $1,649 | $31.50 | $1,586 | 1.04 |
| 2012-05 | $1,589 | $28.70 | $1,471 | 1.08 |
| 2012-06 | $1,599 | $28.00 | $1,444 | 1.11 |
| 2012-07 | $1,594 | $27.40 | $1,426 | 1.12 |
| 2012-08 | $1,630 | $28.80 | $1,453 | 1.12 |
| 2012-09 | $1,745 | $33.60 | $1,624 | 1.07 |
| 2012-10 | $1,747 | $33.20 | $1,636 | 1.07 |
| 2012-11 | $1,722 | $32.80 | $1,576 | 1.09 |
| 2012-12 | $1,685 | $31.90 | $1,582 | 1.07 |
| 2013-01 | $1,672 | $31.10 | $1,639 | 1.02 |
| 2013-02 | $1,628 | $30.30 | $1,675 | 0.97 |
| 2013-03 | $1,593 | $28.80 | $1,583 | 1.01 |
| 2013-04 | $1,488 | $25.40 | $1,493 | 1.00 |
| 2013-05 | $1,414 | $23.00 | $1,475 | 0.96 |
| 2013-06 | $1,343 | $21.10 | $1,430 | 0.94 |
| 2013-07 | $1,286 | $19.70 | $1,401 | 0.92 |
| 2013-08 | $1,352 | $21.90 | $1,496 | 0.90 |
| 2013-09 | $1,349 | $22.60 | $1,457 | 0.93 |
| 2013-10 | $1,317 | $21.90 | $1,413 | 0.93 |
| 2013-11 | $1,276 | $20.80 | $1,420 | 0.90 |
| 2013-12 | $1,222 | $19.70 | $1,356 | 0.90 |
| 2014-01 | $1,244 | $19.90 | $1,421 | 0.88 |
| 2014-02 | $1,300 | $20.80 | $1,410 | 0.92 |
| 2014-03 | $1,336 | $20.70 | $1,452 | 0.92 |
| 2014-04 | $1,298 | $19.70 | $1,430 | 0.91 |
| 2014-05 | $1,289 | $19.30 | $1,456 | 0.89 |
| 2014-06 | $1,279 | $19.90 | $1,453 | 0.88 |
| 2014-07 | $1,311 | $20.90 | $1,492 | 0.88 |
| 2014-08 | $1,295 | $19.70 | $1,446 | 0.90 |
| 2014-09 | $1,237 | $18.40 | $1,359 | 0.91 |
| 2014-10 | $1,222 | $17.20 | $1,260 | 0.97 |
| 2014-11 | $1,175 | $16.00 | $1,208 | 0.97 |
| 2014-12 | $1,201 | $16.30 | $1,215 | 0.99 |
| 2015-01 | $1,251 | $17.20 | $1,242 | 1.01 |
| 2015-02 | $1,227 | $16.80 | $1,197 | 1.03 |
| 2015-03 | $1,179 | $16.20 | $1,139 | 1.04 |
| 2015-04 | $1,199 | $16.30 | $1,151 | 1.04 |
| 2015-05 | $1,199 | $16.80 | $1,140 | 1.05 |
| 2015-06 | $1,182 | $16.10 | $1,089 | 1.09 |
| 2015-07 | $1,128 | $15.10 | $1,009 | 1.12 |
| 2015-08 | $1,118 | $14.90 | $984 | 1.14 |
| 2015-09 | $1,125 | $14.80 | $964 | 1.17 |
| 2015-10 | $1,159 | $15.80 | $977 | 1.19 |
| 2015-11 | $1,086 | $14.50 | $885 | 1.23 |
| 2015-12 | $1,076 | $14.10 | $860 | 1.25 |
| 2016-01 | $1,098 | $14.10 | $855 | 1.28 |
| 2016-02 | $1,200 | $15.20 | $919 | 1.31 |
| 2016-03 | $1,245 | $15.50 | $968 | 1.29 |
| 2016-04 | $1,242 | $16.40 | $994 | 1.25 |
| 2016-05 | $1,261 | $16.90 | $1,036 | 1.22 |
| 2016-06 | $1,276 | $17.30 | $984 | 1.30 |
| 2016-07 | $1,337 | $20.00 | $1,088 | 1.23 |
| 2016-08 | $1,340 | $19.60 | $1,122 | 1.19 |
| 2016-09 | $1,327 | $19.40 | $1,047 | 1.27 |
| 2016-10 | $1,267 | $17.70 | $959 | 1.32 |
| 2016-11 | $1,238 | $17.40 | $955 | 1.30 |
| 2016-12 | $1,157 | $16.40 | $918 | 1.26 |
| 2017-01 | $1,192 | $16.90 | $971 | 1.23 |
| 2017-02 | $1,234 | $17.90 | $1,008 | 1.22 |
| 2017-03 | $1,231 | $17.60 | $963 | 1.28 |
| 2017-04 | $1,267 | $18.00 | $961 | 1.32 |
| 2017-05 | $1,246 | $16.70 | $930 | 1.34 |
| 2017-06 | $1,260 | $16.90 | $931 | 1.35 |
| 2017-07 | $1,237 | $16.20 | $919 | 1.35 |
| 2017-08 | $1,283 | $17.00 | $973 | 1.32 |
| 2017-09 | $1,314 | $17.40 | $964 | 1.36 |
| 2017-10 | $1,280 | $16.90 | $921 | 1.39 |
| 2017-11 | $1,282 | $17.00 | $934 | 1.37 |
| 2017-12 | $1,264 | $16.20 | $907 | 1.39 |
| 2018-01 | $1,331 | $17.10 | $990 | 1.34 |
| 2018-02 | $1,331 | $16.60 | $987 | 1.35 |
| 2018-03 | $1,325 | $16.50 | $955 | 1.39 |
| 2018-04 | $1,335 | $16.60 | $924 | 1.44 |
| 2018-05 | $1,303 | $16.50 | $905 | 1.44 |
| 2018-06 | $1,282 | $16.50 | $885 | 1.45 |
| 2018-07 | $1,238 | $15.70 | $832 | 1.49 |
| 2018-08 | $1,202 | $15.00 | $805 | 1.49 |
| 2018-09 | $1,198 | $14.30 | $805 | 1.49 |
| 2018-10 | $1,215 | $14.60 | $830 | 1.46 |
| 2018-11 | $1,221 | $14.40 | $846 | 1.44 |
| 2018-12 | $1,250 | $14.80 | $791 | 1.58 |
| 2019-01 | $1,292 | $15.60 | $807 | 1.60 |
| 2019-02 | $1,320 | $15.80 | $818 | 1.61 |
| 2019-03 | $1,301 | $15.30 | $843 | 1.54 |
| 2019-04 | $1,286 | $15.10 | $887 | 1.45 |
| 2019-05 | $1,284 | $14.70 | $834 | 1.54 |
| 2019-06 | $1,359 | $15.00 | $808 | 1.68 |
| 2019-07 | $1,413 | $15.80 | $844 | 1.67 |
| 2019-08 | $1,500 | $17.20 | $859 | 1.75 |
| 2019-09 | $1,511 | $18.20 | $945 | 1.60 |
| 2019-10 | $1,495 | $17.60 | $897 | 1.67 |
| 2019-11 | $1,471 | $17.20 | $902 | 1.63 |
| 2019-12 | $1,479 | $17.10 | $924 | 1.60 |
| 2020-01 | $1,561 | $18.00 | $987 | 1.58 |
| 2020-02 | $1,597 | $17.90 | $961 | 1.66 |
| 2020-03 | $1,592 | $14.90 | $759 | 2.10 |
| 2020-04 | $1,683 | $15.10 | $754 | 2.23 |
| 2020-05 | $1,716 | $16.30 | $790 | 2.17 |
| 2020-06 | $1,732 | $17.70 | $821 | 2.11 |
| 2020-07 | $1,847 | $20.60 | $865 | 2.14 |
| 2020-08 | $1,969 | $27.00 | $940 | 2.09 |
| 2020-09 | $1,922 | $25.70 | $908 | 2.12 |
| 2020-10 | $1,900 | $24.20 | $876 | 2.17 |
| 2020-11 | $1,866 | $24.10 | $912 | 2.05 |
| 2020-12 | $1,858 | $25.00 | $1,028 | 1.81 |
| 2021-01 | $1,867 | $25.90 | $1,091 | 1.71 |
| 2021-02 | $1,808 | $27.30 | $1,207 | 1.50 |
| 2021-03 | $1,718 | $25.60 | $1,181 | 1.45 |
| 2021-04 | $1,760 | $25.70 | $1,209 | 1.46 |
| 2021-05 | $1,850 | $27.50 | $1,214 | 1.52 |
| 2021-06 | $1,835 | $27.00 | $1,124 | 1.63 |
| 2021-07 | $1,808 | $25.70 | $1,086 | 1.66 |
| 2021-08 | $1,785 | $24.00 | $1,009 | 1.77 |
| 2021-09 | $1,775 | $23.20 | $973 | 1.82 |
| 2021-10 | $1,777 | $23.40 | $1,017 | 1.75 |
| 2021-11 | $1,822 | $24.20 | $1,038 | 1.76 |
| 2021-12 | $1,790 | $22.50 | $945 | 1.89 |
| 2022-01 | $1,816 | $23.20 | $994 | 1.83 |
| 2022-02 | $1,856 | $23.50 | $1,049 | 1.77 |
| 2022-03 | $1,948 | $25.30 | $1,043 | 1.87 |
| 2022-04 | $1,937 | $24.50 | $965 | 2.01 |
| 2022-05 | $1,849 | $21.90 | $958 | 1.93 |
| 2022-06 | $1,837 | $21.60 | $957 | 1.92 |
| 2022-07 | $1,733 | $19.10 | $869 | 1.99 |
| 2022-08 | $1,765 | $19.70 | $909 | 1.94 |
| 2022-09 | $1,681 | $18.90 | $881 | 1.91 |
| 2022-10 | $1,664 | $19.40 | $915 | 1.82 |
| 2022-11 | $1,725 | $21.00 | $989 | 1.74 |
| 2022-12 | $1,798 | $23.30 | $1,011 | 1.78 |
| 2023-01 | $1,898 | $23.70 | $1,053 | 1.80 |
| 2023-02 | $1,855 | $21.90 | $959 | 1.93 |
| 2023-03 | $1,913 | $22.00 | $971 | 1.97 |
| 2023-04 | $2,000 | $25.00 | $1,051 | 1.90 |
| 2023-05 | $1,992 | $24.30 | $1,063 | 1.87 |
| 2023-06 | $1,943 | $23.40 | $971 | 2.00 |
| 2023-07 | $1,951 | $24.30 | $950 | 2.05 |
| 2023-08 | $1,919 | $23.40 | $925 | 2.07 |
| 2023-09 | $1,916 | $23.10 | $921 | 2.08 |
| 2023-10 | $1,916 | $22.40 | $892 | 2.15 |
| 2023-11 | $1,984 | $23.50 | $906 | 2.19 |
| 2023-12 | $2,026 | $23.90 | $935 | 2.17 |
| 2024-01 | $2,034 | $22.90 | $926 | 2.20 |
| 2024-02 | $2,023 | $22.70 | $894 | 2.26 |
| 2024-03 | $2,158 | $24.50 | $909 | 2.37 |
| 2024-04 | $2,331 | $27.50 | $940 | 2.48 |
| 2024-05 | $2,351 | $29.40 | $1,015 | 2.32 |
| 2024-06 | $2,326 | $29.60 | $985 | 2.36 |
| 2024-07 | $2,398 | $29.80 | $979 | 2.45 |
| 2024-08 | $2,470 | $28.50 | $945 | 2.61 |
| 2024-09 | $2,571 | $30.10 | $967 | 2.66 |
| 2024-10 | $2,690 | $32.40 | $999 | 2.69 |
| 2024-11 | $2,651 | $31.10 | $966 | 2.74 |
| 2024-12 | $2,648 | $30.80 | $938 | 2.82 |
| 2025-01 | $2,710 | $30.40 | $949 | 2.86 |
| 2025-02 | $2,895 | $32.20 | $978 | 2.96 |
| 2025-03 | $2,983 | $33.20 | $980 | 3.04 |
| 2025-04 | $3,218 | $32.20 | $959 | 3.36 |
| 2025-05 | $3,309 | $32.80 | $980 | 3.38 |
| 2025-06 | $3,353 | $36.00 | $1,251 | 2.68 |
| 2025-07 | $3,340 | $37.70 | $1,391 | 2.40 |
| 2025-08 | $3,368 | $38.20 | $1,343 | 2.51 |
| 2025-09 | $3,668 | $42.80 | $1,435 | 2.56 |
| 2025-10 | $4,058 | $49.40 | $1,616 | 2.51 |
| 2025-11 | $4,087 | $50.40 | $1,565 | 2.61 |
| 2025-12 | $4,309 | $62.30 | $1,893 | 2.28 |
| 2026-01 | $4,753 | $92.10 | $2,434 | 1.95 |
| 2026-02 | $5,020 | $81.90 | $2,137 | 2.35 |
| 2026-03 | $4,856 | $77.90 | $2,046 | 2.37 |
| 2026-04 | $4,721 | $75.90 | $2,028 | 2.33 |
| 2026-05 | $4,587 | $78.00 | $1,998 | 2.30 |
| 2026-06 | $4,228 | $66.70 | $1,726 | 2.45 |
| 2026-07 | $4,073 | $58.80 | $1,622 | 2.51 |
| 2026-08 | $4,411 | $65.40 | $1,780 | 2.48 |
| 2026-09 | $4,319 | $64.60 | $1,784 | 2.42 |